Huron-Clinton Metroparks Greenhouse Gas Inventory
Presented by Corvias Infrastructure Solutions and 389nm | September 2025
Metrics for Year: 2024
Scope 1 Stationary (tCO2e)
0.0
Heating & Hot Water
Scope 1 Mobile (tCO2e)
0.0
Gasoline & Diesel
Scope 2 Market-Based (tCO2e)
0.0
From purchased electricity
Total Electricity (kWh)
0
Total consumption
Total Gas & Propane (therms)
0.0
Natural gas + propane
Executive Summary
This document provides a comprehensive Greenhouse Gas (GHG) emissions inventory for the Huron-Clinton Metroparks Authority (HCMA), establishing a baseline for its environmental impact and outlining a strategic framework for future climate action. The inventory is designed to align with the HCMA's broader Climate Action Plan goals, focusing on key areas such as emissions reduction, carbon sequestration, and the transition to a low-carbon economy.
Key Findings
The inventory identifies and quantifies emissions from various sources, categorized by their scope:
- Scope 1 Emissions: These are direct emissions from sources owned and controlled by the HCMA. In 2024, the primary sources were fleet and equipment use, consuming an estimated 174,047 gallons of gasoline and 69,585 gallons of diesel fuel. Stationary combustion for heating and hot water, using 118,588 therms of natural gas and propane, was another significant source. Total Scope 1 emissions were approximately 2,906.5 tCO2e.
- Scope 2 Emissions: These are indirect emissions from purchased electricity. In 2024, the HCMA used 5,048 MWh of electricity, resulting in approximately 5,305 tCO2e based on DTE's specific generation mix. These are market-based emissions, which are accurate to the mix of electricity generation from the supplier, including natural gas and coal-fired generation.
- Scope 3 Emissions: These are other indirect emissions from supply chain activities, such as waste management and electronics recycling. This inventory provides a limited assessment. With more detailed tracking in the future, Scope 3 emissions may be estimated. They are typically over half of the emissions related to an organization’s operations.
The HCMA emissions were compared against other similarly sized park districts that reported emissions within the last decade. The HCMA’s emissions were found to be in line with its peers while presenting an opportunity for improvement. If compared to average household emissions for the United States, HCMA would emit the equivalent of 595 households annually.
Table 1. Total Greenhouse Gas Emissions, 2024
| Scope 1 | tCO2e |
|---|---|
| Stationary Emissions | 655.0 |
| Mobile Emissions | 2,252.0 |
| Emissions from Agricultural Land | 449.0 |
| Avoided Emissions from Carbon Sequestration | -32,881.0 |
| Scope 2 | tCO2e |
| Electricity Generation Emissions (Market-Based) | 5,305.0 |
| Scope 3 | tCO2e |
| Waste Generated in Operations | -4.0 |
Figure 1. Total Facility and Mobile Sourced Emissions for 2024
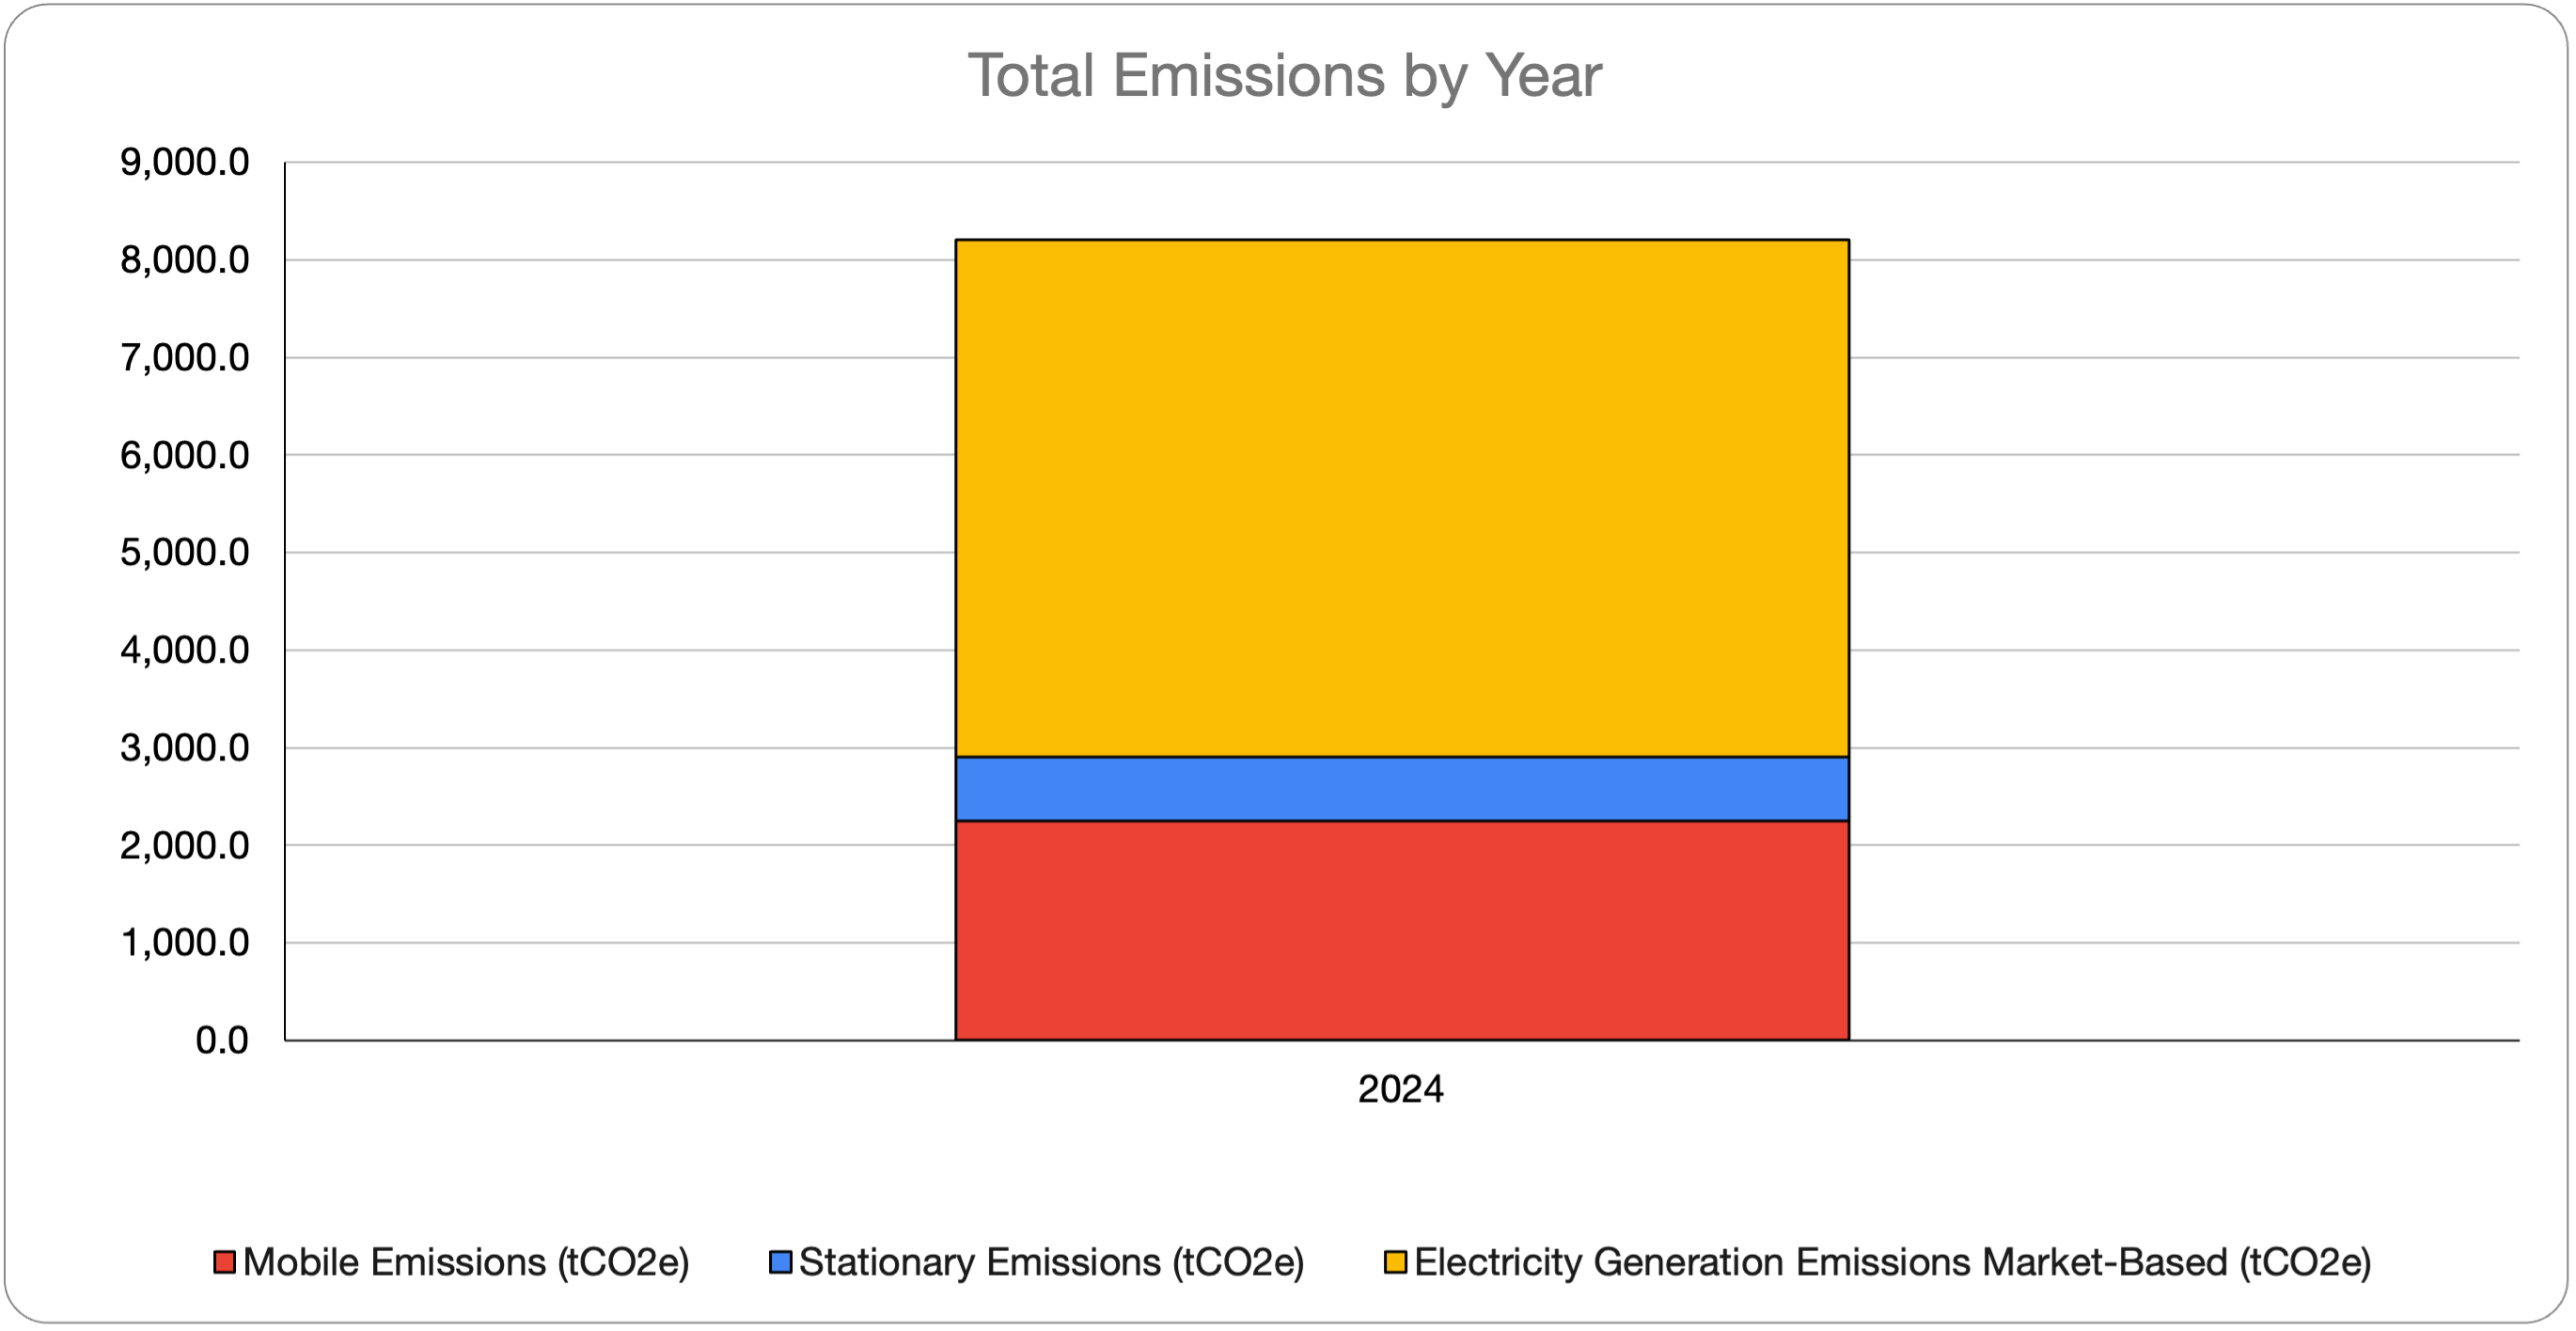
Figure 1. Total Facility and Mobile Sourced Emissions for 2024
Table 2. Summary of Greenhouse Gas Emissions & Sequestration by Park, 2024
| Metropark | Scope 1 Stationary Emissions (tCO2e) | Scope 2 Electricity Generation Emissions (tCO2e) | Ecosystem Sequestration (tCO2e) |
|---|---|---|---|
| Indian Springs | 0.0 | 418.9 | -2037.7 |
| Kensington | 30.2 | 990.9 | -3452.6 |
| Huron Meadows | 56.6 | 319.3 | -1898.9 |
| Hudson Mills | 65.8 | 197.8 | -1571.2 |
| Dexter-Huron | 0.0 | 18.0 | -210.6 |
| Delhi | 0.0 | 14.9 | -176.3 |
| Lower Huron | 0.0 | 117.2 | -1401.8 |
| Willow | 0.0 | 427.6 | -1437.9 |
| Oakwoods | 0.0 | 511.0 | -1777.2 |
| Lake Erie | 0.0 | 473.3 | -1561.1 |
| Lake St. Clair | 302.3 | 926.2 | -938.2 |
| Wolcott Mill | 129.5 | 150.2 | -1367.2 |
| Stony Creek | 50.9 | 727.6 | -2990.5 |
Carbon Sequestration
The HCMA's extensive land holdings provide a significant natural "sink" for GHG emissions, a system that takes up more carbon than it releases. This is known as carbon sequestration, and the emissions associated with sequestration are reported as negative numbers. In HCMA’s case, forests, wetlands, grasslands, and soils remove CO₂ from the air and store it in plants and soil, providing opportunities to increase long-term storage through conservation and management. The 21,037 acres of natural communities, including forests, wetlands, and grasslands, have a total carbon storage potential of over -1.8 million tCO2e. This is roughly equal to annual CO2 equivalent emissions from 400,000 passenger vehicles, 30 million tree seedlings grown over 10 years, or the annual electricity consumption of 225,000 homes. These lands sequester an additional -32,880.5 tCO2e annually as they mature, demonstrating the vital role of these ecosystems in mitigating the HCMA's overall carbon footprint. Prescribed burning practices further enhance this sequestration potential by promoting healthy ecosystem regrowth.
The inventory provides a snapshot in time for the HCMA, providing a way to benchmark and baseline emissions that will be used to track progress in future years. The inventory provides information on both emissions by the HCMA and sequestration, the carbon “sink” the HCMA provides in its natural communities. These sinks more than cover the annual emissions of the HCMA from a carbon accounting perspective; however, the HCMA recognizes that its sequestration is in service to the entire metropolitan area. Michigan was 95% forested in 1850, a baseline year commonly used to denote pre-industrialization. It is now approximately 53% forested, and much of this is in the Upper Peninsula and in the Huron-Manistee National Forest. The HCMA, therefore, views increasing its ecosystem quality and quantity AND reducing its operational emissions as imperative to meeting the challenge of climate change through 2050 and beyond.
Opportunities and Recommendations
The document outlines opportunities to reduce emissions and increase sequestration, providing a roadmap for a low-carbon transition plan:
- Electrification: Transitioning the fleet and facility equipment to electric or hybrid models is the most impactful opportunity for reducing Scope 1 emissions. This includes exploring electric vehicles for light-duty trucks and cars and developing the necessary charging infrastructure.
- Energy Efficiency: A key strategy for buildings is to implement energy efficiency retrofits and upgrades, which can reduce the need for purchased electricity and lower Scope 2 emissions.
- Land Management: Strategic land management practices, such as converting turf areas to natural meadows and using regenerative agriculture, can increase carbon sequestration rates and reduce emissions from maintenance activities.
- Data Collection: To improve the accuracy of future inventories, the document recommends a more rigorous data collection process for Scope 1 transportation and refrigerant emissions, as well as for Scope 3 waste emissions.
The results of this inventory provide the necessary data to set Specific, Measurable, Achievable, Relevant, and Time-bound (S.M.A.R.T.) targets for emissions reduction, guiding the HCMA toward a more sustainable future.
Background Information
Climate change is a normal process over the eons of Earth’s history, but has a massive impact on livability and viability of organisms when it occurs over a short period of time. The level of climate change we are experiencing now has not happened in 10,000 years, since before the beginning of civilization, and is happening 10 times faster than it typically does in periods of time like the one we are in now. Greenhouse gas emissions are a controllable effect of civilization, and strategies to reduce them are necessary to mitigate the worst effects of climate change.
The Huron-Clinton Metroparks Climate Action Plan dated October 2023 provides a summary of the conditions specific to the HCMA as well as an understanding of probable changes over the next century. The summary below is provided to focus on greenhouse gas inventories and how they are used to benchmark and baseline targets and implementation plans for absolute emissions reductions.
Greenhouse Gas Emissions
Greenhouse Gas (GHG) emissions affect the atmosphere by reflecting light, primarily in the infrared spectrum, back to the surface of the Earth instead of dissipating this energy to space. This has an effect of trapping heat in the troposphere, the part of Earth that supports life, and causes climate change through global warming. There are other chemical and physical processes that both mitigate and exacerbate climate change. These processes are not considered as part of this effort.
GHGs include gases common to the atmosphere as well as human-made components. The most common GHG emitted is carbon dioxide tCO2e. The level of carbon dioxide in the atmosphere has increased by approximately 50% since the industrial revolution (1850) due to human caused emissions. Other natural activities, such as sequestration of carbon and fixing nitrogen in healthy soils, can mitigate or reverse the concentration of greenhouse gases in the atmosphere. Collectively, these emissions create a net increase in global average temperature.
When reviewing emissions, the weight of an activity is considered by its Global Warming Potential (GWP). For example, reducing refrigerant use can sometimes have a larger impact on GHG emissions than reducing electricity use because the GWP of certain refrigerants when they are released into the atmosphere is greater than the GWP of burning fossil fuels for electricity generation. All emissions of all greenhouse gases in this report are reviewed over a 100-year timeframe, as that is how long some greenhouse gases remain potent before being made chemically or physically inert.
The primary sources for the purpose of this document include:
- Fossil fuels burned for energy consumption to power and heat buildings and processes
- Fugitive refrigerants (those which are released into the atmosphere accidentally) from air conditioning equipment
- Fossil fuels burned for energy consumption to power vehicles
- Fossil fuels burned for energy consumption to clean and treat water
- Fossil fuels burned in supply chain activities purchasing habits
Not all activities release GHG emissions. The HCMA has several sinks of emissions (i.e., anything which absorbs more emissions from the atmosphere than it releases) at its disposal. These include:
- Wetland, prairie, and habitat restoration
- Managed forests
- Prescribed burning of shrubland and grassland
Together, these sources and sinks comprise a GHG emissions budget for the HCMA.
Table 3. Carbon Dioxide Equivalencies*
| Gas Name | CO2e (Carbon dioxide-equivalent) | Residence Time (years) | Source |
|---|---|---|---|
| Carbon Dioxide (CO2) | 1:1 | 1000s | Fossil fuel combustion, anaerobic decomposition of organic material (landfills) |
| Nitrous Oxide (N2O) | 273:1 | 100 | Crop production, fossil fuel combustion |
| Methane | 27.2 (non-fossil) - 29.8 (fossil):1 | 100 | Livestock production, natural gas fugitive emissions, anaerobic decomposition of organic material (landfills) |
| Chlorofluorocarbons (CFCs) | 5,820 - 13,900:1 | 100 | Refrigerants (R11, R12, etc.) |
| Hydrofluorocarbons (HFCs) | 4 - 12,400:1 | 14.6 | Refrigerants (R22, R404A, etc.) |
| Hydrochlorofluorocarbons (HCFCs) | 79 - 1,980:1 | 14 | Refrigerants (R134, R410A, etc.) |
* International Panel on Climate Change Assessment Report 6, 2021
Carbon Sequestration
Carbon sequestration refers to the natural “sink” of greenhouse gases that exists in the troposphere in natural communities. The primary greenhouse gas emissions included are soil organic carbon (from carbon dioxide), avoided nitrogen emissions, and avoided methane emissions. To a lesser extent, unextracted fossil fuels are sequestered, but they are not included as part of the carbon accounting of sequestration.
There are two potential sequestration sources that arise from HCMA’s operations. These are:
- Natural communities such as forests, wetlands, and grasslands owned and managed by the HCMA that naturally sequester carbon dioxide (and create soil organic matter rich in carbon as well as above ground and below ground woody structures from growing plants). These include natural communities that may be managed by prescribed burning to retain a natural landscape in line with historical fire management.
- Agricultural lands that may practice regenerative farming, which reduces inputs from fossil-fuel derived fertilizer.
Management of natural communities that brings them closer to mature old-growth communities has the largest sequestration potential year over year, before they become mature and generally come into equilibrium as both a source of carbon (through decomposition) and a sink. Mature communities are generally considered to be as they were before 1850, and often take close to 100 years to reach maturity when starting from a disturbed or developed state. Often it is not possible to return a community to its historic natural state.
Sequestration values are heavily dependent on the type of natural community and are directly related to weather and plant community types. For example, soil organic carbon is a dominant carbon pool in prairie ecosystems, where woody above ground biomass may be dominant in forest ecosystems. Wetlands may store carbon in hummus and peat, which are dead or decaying plant matter that has not been broken down significantly by decomposers such as fungi and bacteria due to the physical and chemical conditions of the site. Some communities have some sequestration value, but may also be net emitters due to management practices. These include turf management and cropland.
Forestry and wetland values have been derived from research provided by the USDA for total sequestration for a mature 30 year old forest and adjusted to fit a 100 year annual sequestration recovery to a mature late succession forest. They are considered approximate. Cropland values are modeled after a standard corn-soy rotation in Michigan using COMET-Farm, which derives values using DAYCENT.
Table 4. Annual Carbon Sequestration Values By Ecosystem Type
| Ecosystem Type | Annual tCO2e per Acre | Description |
|---|---|---|
| Conventional Cropland | 0.5 | Cropland with applied fertilizer, conventional till, no cover crop |
| Conventional Cropland - No Till | 0.1 | Cropland with applied fertilizer, low/no till, cover crop |
| Regenerative Conversion | -0.2 | Regenerative corn/soy/alfalfa rotation, limited manure application |
| Forest - Burn Managed | -0.8 | Average forest sequestration + 9 to 25% improvement |
| Grasslands - Burn Managed | -2.0 | Average grassland sequestration + 9 - 25% improvement |
| Grasslands - Dry Mesic Prairie | -1.6 | Well drained prairie/grassland |
| Grasslands - Wet Mesic Prairie | -2.0 | Moderately drained prairie/grassland |
| White-Red-Jack Pine Forest | -0.6 | Mixed conifer forest |
| Aspen-Birch Forest | -0.8 | Mixed deciduous forest |
| Maple-Beech-Birch Forest | -0.8 | Mixed deciduous forest |
| Elm-Ash-Cottonwood Forest | -0.9 | Mixed deciduous forest |
| Oak-Hickory Forest | -0.7 | Mixed deciduous forest |
| Spruce-Balsam Fir Forest | -1.1 | Mixed conifer boreal forest |
| Oak Barrens | -0.9 | Prairie oak open forest/savanna |
| Palustrine, Riverine and Lacustrine Emergent | -3.0 | Emergent wetland/marsh |
| Palustrine, Riverine and Lacustrine Shrub | -2.3 | Shrub wetland/southern shrub-carr |
| Southern Wet Meadow | -2.5 | Wet prairie |
| Southern Hardwood Swamp | -3.8 | Mineral to organic soil inundated tree dominant swamp |
| Rich Tamarack Swamp | -2.8 | Poor nutrient inundated tree dominant swamp |
| Palustrine, Riverine and Lacustrine Forested | -3.0 | Flood plain forest/forested wetland |
| Palustrine, Riverine and Lacustrine Farmed | -0.3 | Flood plain minimally productive cropland |
| Palustrine, Riverine and Lacustrine Unconsolidated Bottom and Aquatic Bed | -2.5 | Prairie fen or bog |
| Open Water | -0.1 | Lakes or ponds |
Climate Action Plan Goals
The following goals are taken directly from the Huron-Clinton Metroparks Climate Action Plan dated October, 2023. Goal action items are referenced in the Opportunities section for each part of the Inventory. These Goals provide a framework for focus action on emissions reduction that may be undertaken following the results of this inventory. Where there is opportunity to meet these goals, they are referenced in the inventory. This inventory is considered a living document that will be updated annually to track progress against reduction targets.
Education & Engagement
Increase and embed climate action education across all areas of the Metroparks through sharing of knowledge, engaging with others, collaborating with partners, and forming connections with stakeholders, to make real world difference across the Metroparks and throughout our region.
- Beginning in 2024, provide annual education to all Metroparks staff on issues of climate resilience, climate equity, stewardship, and adaptation.
- Beginning in 2024, provide collective engagement tools across every department within the Metroparks on issues of climate resilience, climate equity, stewardship, and adaptation on an annual basis.
- Integrate concepts of climate change into existing and new programs at the Metroparks and throughout our region.
- By 2028, host an Interpretive Regional Climate Action Conference, encouraging Interpreters and educators from across the region to attend and present on climate-related programming that they conduct. This would introduce staff to potentially new, innovative ways of presenting climate programming.
Preservation & Conservation of Natural Resources
Protect and enhance natural resources to ensure longevity of important ecosystems in a changing climate, to preserve these resources for the benefit of future generations.
- Protect important natural resources elements, including threatened and endangered species, and preserve biodiversity of ecosystems facing the pressures of climate change.
- Integrate our land management best practices to align with the changing climate and adapt habitat management strategies and plans for on-the-ground work consistent with best management practices.
- Enhance, expand, and restore natural areas and strengthen the ability of ecosystems to combat pressures of climate change.
- Protect existing and acquire additional undeveloped lands as a resource to buffer ecosystems and infrastructure from the pressures of surrounding land use and effects of climate change. Consider divestment of undesired parcels and reinvestment in acquisition of critical parcels.
- Build strategies into all “existing and future” plans to incorporate climate adaptation resilience.
- Increase capacity for carbon storage in natural areas and pursue projects for the intentional storage of carbon.
Water Quality
Enhance built and natural stormwater infrastructure in preparation for increasingly intense storms, and support the protection of water quality.
- Beginning in 2024, provide annual education opportunities to staff on issues of stormwater management and water conservation.
- Adopt innovative strategies to capture and manage stormwater in preparation for more severe storms and educate the public about these efforts.
- Become a prominent stormwater management partner in the region.
- Adopt a practice of strategic water usage that minimizes stress on and protects regional water resources.
- Monitor and protect quality of water resources adjacent to and in close proximity to the Metroparks from pollution, erosion, contamination, and other detrimental effects exacerbated (i.e., accelerated or increased) by climate change.
- Partner with regional organizations, including government agencies, watershed councils, non-profits, and corporate and philanthropic organizations to identify alignment and advance mutual goals of water quality protection in a changing climate.
- Advocate for the protection of water resources.
Transportation
Reduce carbon emissions associated with transportation vehicle miles traveled and provide equitable transportation options to and within the Metroparks to help mitigate the impacts of climate change.
- Identify and evaluate efforts to reduce the vehicle miles traveled by Metroparks staff and reduce current levels of carbon emissions emitted.
- Explore the viability of using an EV fleet and developing EV charging infrastructure by 2033.
- Increase connectivity within our parks.
- Increase access to the Metroparks by centering environmental justice through every transit investment.
- Create an internal EV transit system within the Metroparks that have the highest vehicle counts.
- Explore the viability of micro-mobility modes of transportation within Metroparks.
Waste Management, Recycling & Composting
Decrease the amount of waste going to landfills by increasing efforts internally and with the public to refuse, reduce, reuse, repurpose, and recycle materials.
- Increase waste diversion rates internally, including vendors, through reducing, reusing, and recycling.
Method
Greenhouse Gas Inventory
Inventory Boundary
A GHG emissions inventory involves setting boundaries based on factors within the control of a user or source and determining how best to allocate emissions to each source. Some sources are easier to calculate than others because source emissions are known and can be easily modeled (either as fuel purchases or metered consumption). Other emissions are harder to calculate and more complicated to model. Throughout this document emissions were calculated while also reporting the fidelity of the data to estimate emissions for the HCMA. A more extensive review of emissions from sectors may be conducted in the future to develop low-carbon transition plans for each site or use case. For this document, a broad review was developed to meet the needs of establishing a baseline.
The boundary for operations includes all buildings, equipment and vehicles owned and operated by the HCMA. Resources considered include fossil fuels used by vehicles, including gasoline and diesel fuel; resources used by buildings, including natural gas, propane, electricity, water, and municipal solid waste. The boundary considers emissions and sequestration from natural areas and cropland. The boundary does not include visitor emissions from vehicles used to visit parks.
This document follows the Global Protocol for Community Scale Greenhouse Gas Inventories and includes required emissions sources. Where possible, the project team has estimated emissions from other sources and documented the emissions calculations. Emissions breakdowns include Scope 1, Scope 2, and Scope 3 emissions, which are categorized by where emissions physically occur (see Figure 2).
Scope 1
For the purposes of this inventory, Scope 1 emissions are “GHG emissions from sources located within the [HCMA] boundary” (Greenhouse Gas Protocol, 2021, pg. 11). These emissions refer to emissions from stationary combustion, fugitive refrigerant, and methane emissions and mobile combustion. They are primarily from burning fossil fuels for space and process heating and for locomotion of vehicles. Primary GHGs reported from stationary combustion are carbon dioxide (CO2), nitrous oxides (N2O) and methane (CH4). Fugitive emissions include refrigerants and methane emissions during process or transport. Mobile combustion emissions are from transportation and primarily include carbon dioxide, nitrous oxide, and methane. Criteria pollutants such as total volatile organic compounds/total hydrocarbons, carbon monoxide (CO), particulate matter, and sulfur dioxides are also significant emissions from Scope 1. Criteria pollutants contribute to unhealthy air quality, especially in the summer during heat waves. These are becoming exacerbated in a warming world as the number of days of unhealthy air quality continue to increase annually.
Scope 2
For the purposes of this inventory, Scope 2 emissions are “GHG emissions occurring as a consequence of the use of grid-supplied electricity, heat, steam and/or cooling within the [HCMA] boundary” (Greenhouse Gas Protocol, 2021, pg. 11). They result from the activities of the reporting organization but are emitted elsewhere. The most common reported Scope 2 emission is generated electricity used for lighting, plug load, motors, and water and space heating. Its primary GHGs are carbon dioxide and nitrous oxides, though other criteria pollutants are involved in the burning of fossil fuels for electricity generation.
Water consumption also contributes to both Scope 1 and Scope 2 emissions, as the treatment of waste water is energy intensive. One study places the average emissions for waste water treatment in the United States is $0.00175 tCO2e per kgal, but the emissions are dependent on the energy used for local treatment and its source.
Scope 3
For the purposes of this inventory, Scope 3 emissions are “all other GHG emissions that occur outside the [HCMA] boundary as a result of activities taking place within the [HCMA] boundary” (Greenhouse Gas Protocol, n.d., pg. 11). These are indirect emissions from all other sources, including waste management, purchasing, travel, and other supply chain-related activities. An exhaustive inventory of Scope 3 emissions is a longer-term undertaking and requires data collection and analysis beyond the scope of this inventory. Where data is available, Scope 3 emissions have been calculated or are estimated based on publicly available data sources from similar sources. This inventory covers the basic reporting totals as specified by the Global Protocol for Community-Scale Greenhouse Gas Inventories (Greenhouse Gas Protocol, 2021, pg. 12).
GHG Emissions by Scope (Figure 2)
Units Reported
Throughout the report we have chosen to use units that are most familiar to a reader in the United States and have reported energy, area, and volume consumption in Imperial units. Results of GHG emissions are often reported using SI (International System of Units) internationally, and that convention has been followed here. As such, this report often reports emissions in terms of metric tonnes of carbon dioxide-equivalent listed as tCO2e. For context, 1 tCO2e is equivalent to the emissions from consuming 113 gallons of gasoline or burning 1,106 pounds of coal burned (U.S. Environmental Protection Agency, n.d.).
Data Collection
The HCMA provided inventories of all operational equipment, fuel, and energy purchases to estimate Scope 1 stationary and mobile emissions, as well as Scope 2 emissions. Scope 3 avoided waste emissions were estimated from weights provided in recycling reports.
Data Limitations
Every effort was made to gather accurate data to provide a complete picture of the greenhouse gas emissions of the HCMA. Scope 2 emissions are likely to be within 10% of actual emissions, as all operations are metered. Scope 1 and Scope 3 emissions have larger estimates as detailed below:
- Scope 1 transportation emissions have estimates for non-B20 diesel consumption, and non-E85 gasoline consumption. Estimates were incorporated from input from HCMA staff. The actual emissions are likely higher than reported. Future inventories will take refined information into account. We estimate this error to be approximately 18%.
- Scope 1 refrigerant containing equipment emissions are estimated. A full audit of refrigeration containing equipment was not conducted, but instead incorporated refrigerant priming (refills of leaked refrigerant) estimates based on tons of cooling provided by HCMA staff. Emissions are considered minimum and are likely higher than reported.
- Scope 3 waste emissions are based on estimates. At the time of this report, the waste hauler does not report volume or weight of landfill or consumable recycling.
Results
The Greenhouse Gas Inventory Results are provided below and summarized in Table 1.
Carbon Storage Baseline
The HCMA manages 21,037 acres in 2,686 unique parcels of land. These natural communities include dry and wet forests, grasslands such as savannas and prairies, swamps, fens and other wetlands, lakes, and rivers as well as human managed lands such as recreational areas, turf, and cropland. Together these communities provide a baseline of sequestration that includes both annual additional emissions sequestration and a total sink for the year 2024. The total sink of emissions, which comprises the carbon-containing living and dead organic matter, is equal to $-1,827,850.5 tCO2e. Annually it is estimated that $-32,880.5 tCO2e are added based on estimates of the maturity of the natural communities in the parcels (annual sequestration slows down as a natural community matures until it reaches equilibrium over several years in a process known as ecological succession).
Carbon sequestration by sequestration per acre may be reviewed online as an interactive map for the entire HCMA parks system. See Figure 3 for an example map.
Figure 3. Carbon Sequestration Interactive Map

Figure 3. Carbon sequestration by sequestration per acre may be reviewed online as an interactive map for the entire HCMA parks system. (Click image to open map in a new tab)
Business As Usual Projection
If the HCMA does not acquire new parcels or significantly change the management of existing parcels, the annual emissions sequestered will reduce over time and stabilize. There are ways to increase sequestration through different land management practices. Some of these are further detailed in the next section. The HCMA has goals to increase acres of no-mow area as well as adding pollinator-friendly grassland and savanna species within the next decade by several hundred acres.
Opportunities
Carbon sequestration is most effective when converting developed areas back to natural communities, known as afforestation. This may be a wholesale conversion of a developed area to a natural area, or restoration of a once natural community that requires more aggressive invasive species management. It may also involve mixed use, such as agroforestry, where cash crops are grown in conjunction with economically important trees such as fruit trees.
Additional sequestration may come from different management techniques. Reduced nitrogen application in cropland can come from low/no-till agriculture, cover crops, or regenerative transition. These practices must be considered against economic considerations, and may be subsidized by the HCMA to encourage their practice. Turf maintenance emissions have already been reduced by changing maintenance frequency, and electric mowers are being tested for maintenance of recreational areas. Additionally changes to frequency and intensity of maintenance, and additional purchase of electric maintenance equipment could make this practice carbon neutral for some parcels.
Actions include:
- Purchasing or accepting donations of marginal or historically important parcels for preservation.
- Practice low or no-till agriculture on cropland, including cover crops and potentially regenerative transition in partnership with lessees of cropland for each park.
- Convert maintained turf in marginal areas to wildflower meadows.
- Reduce frequency of maintenance on existing turf where feasible.
- Increase prescribed burn in additional management areas where prudent.
Fuel Assessment & Carbon Release
Carbon sequestration provides a sink for natural emissions in the carbon cycle, which includes the capture of atomic carbon and carbon compounds in woody vegetation and soil organic matter. When these natural communities are degraded, that material moves further along the carbon cycle as it is decomposed and no longer removes carbon from the air during organic processes such as photosynthesis. This decomposed organic matter may be consumed by fungi and bacteria and become soil organic carbon, or off gas as part of these processes as other organic gases such as methane. This is a natural process, and is more or less in equilibrium in a natural community. Organic processes release carbon dioxide, which is taken up again and stored by plants and carbon and nitrogen-fixing bacteria.
In the case of deforestation, where woody vegetation is cut and used for products, it may transfer that carbon source to another location and be released into the atmosphere as carbon dioxide through decomposition or burning. In extreme cases, this happens rapidly, as in the case of a forest or grassland fire.
However, in many natural communities, fire is a natural process that actually improves biological processes that store carbon, as well managed forests grow faster and contribute to soil organic carbon generation. Importantly, it reduces the possibility of catastrophic fires. The use of prescribed burns in forest and grassland management can also control invasive shrubs that reduce native trees that ultimately provide a larger potential carbon sink. Annual burns of the same area would release carbon more readily, but periodic burns provide a net benefit to carbon sequestration in some ecosystems estimated between 9% and 25%. Conservatively this equates to -0.07 tCO2e additional tonnes of CO2e sequestration for a forest and $-0.35 tCO2e for a grassland annually. Return periods of two to five years are common, with more frequent burns to control brush if that is desirable.
Business As Usual Projection
The HCMA does prescribed burning in approximately 1,897 acres in 137 parcels in 12 parks with records going back to 2001. This contributes an additional $-398 tCO2e to the carbon sequestration value provided as the baseline. Additionally, when chipped wood and brush are more than can be reused onsite, HCMA has burn pits that are used to eliminate organic matter that otherwise may become a fuel hazard for uncontrolled fires. In the past HCMA has explored waste-to-energy to allow this emission to be mitigated, as it would become part of the electricity generation emissions of the utility. Small scale composting has also been reviewed along with permitting requirements for larger sites.
Opportunities
- Continue to prioritize burn management for shrub and invasive species control.
- Explore areas for additional burn management prioritizing natural community afforestation over edge community maintenance that may be managed with other means (e.g., manual brush removal).
- Continue to chip and reuse woody vegetation or mulch vegetation to use as soil amendment or cover to avoid carbon release from burn piles.
- Explore onsite or dedicated windrow composting for debris as well as waste-to-energy if feasible to mitigate emissions.
Emissions Reduction from No-Mow Areas
The HCMA has published a mowing plan, the Huron-Clinton Metroparks Mow Plan, every three years since 2014. The 2025 Plan provides mowing policy through 2027, and continues a policy to reduce mowing that has been in place since 2008. The policy attempts to balance the needs of park visitors that seek recreational use (picnicking) with park visitors that value natural community restoration and management for biodiversity and threatened species protection.
The park has three classifications of mowing in its plan that classify the frequency of mowing: 1) Regular mow areas, which may be Monday, Wednesday, Friday for golf course fairways or every day for greens, 2) Annual spot mow, and 3) Natural areas. The mowing intensity is split into four classifications for the sake of carbon accounting: 1) Heavily Managed (added fertilizer), 2) High-Managed (non-fertilized, weekly management), 3) Low-Managed (abandoned turfgrass annual mow) and ruderal (one to three year mowing). Ruderal or disturbed sites are mowed to control invasive plant species that colonize disturbed areas first and may begin to invade adjacent sensitive areas.
Though turfgrass does sequester a small amount of carbon, it is a net emitter of emissions due to fossil-fuel operated equipment. Therefore the frequency of mowing directly affects the emissions per acre of turf. Additionally, fertilizer application is a net emitter of emissions. Approximately 1% of fertilizer applied, usually as anhydrous ammonia, is emitted as nitrous oxide by nitrogen-fixing bacteria and not retained in soil. As nitrous oxide is 298 times more potent as a greenhouse gas than CO2, even a small amount can have a large effect. Therefore proper nitrogen management (application process, timing, dose) matter as much or more than mowing frequency to manage emissions from turfgrass management. Heavily managed turf is primarily a function of golf course maintenance, but is also a consideration for recreational areas through the HCMA Metroparks system.
Table 5 . Annual Carbon Sequestration of Turf Grass
| Ecosystem Type | Annual tCO2e per Acre | Description |
|---|---|---|
| Developed - Heavily Managed Turfgrass | -0.4 | Golf course with fertilizer application |
| Developed - High-Managed Turfgrass | -0.6 | Maintained turf grass, regular weekly mow |
| Developed - Low-Managed Turfgrass | -0.8 | Abandoned turf grass, annual mow as needed |
| Ruderal | -0.9 | Disturbed - one to three year mow invasive species management |
Assuming a riding mower can mow an acre of turf in 35 minutes, a diesel mower will consume 1.28 gallons of diesel fuel and emit 0.01 tCO2e. Assuming a maintenance season of 25 weeks, an acre of high-managed turf grass will sequester -0.55 tCO2e and emit 0.33 tCO2e for a net emission of -0.22 tCO2e annually. Annual mowing of an acre of low-managed turfgrass will emit 0.01 tCO2e for a net emission of -0.74 tCO2e annually. Converting high-managed to low-managed turf grass will increase net sequestration of that acre of turf to -0.53 tCO2e annually.
Business As Usual Projection
The HCMA will continue to update its mowing plan every three years to review proper management. All golf courses are currently certified by the Michigan Turfgrass Environmental Stewardship Program and leadership maintains membership at the Golf Course Superintendents Association of America (GCSAA).
Opportunities
- Convert high-management turf areas to low-management turf areas in marginal areas and buffer zones limiting high management to recreational areas.
- Explore alternatives to mowing to manage invasive species control such as manual extraction and prescribed burning (mowing releases the same carbon as prescribed burning while adding fuel emissions).
- Maintain Michigan Turfgrass Environmental Stewardship Program certifications to optimize fertilizer application, especially on golf courses, through soil analysis, remote sensing, timing, fertigation where feasible, and maintenance of buffer zones.
- Restore turf to prairie through restoration projects to eliminate the need for mowing on ruderal sites.
Fleet & Equipment Baseline Emissions
Scope 1 Mobile Emissions
Scope 1 Mobile emissions are primarily categorized as emissions from equipment used primarily within the physical boundary of the HCMA. These include tailpipe emissions from fossil fuel vehicles, emissions from maintenance equipment such as lawn mowers, leaf blowers, chainsaws, ATVs, tractors, backhoes, and equipment used for prescribed burning such as propane torches.
Mobile emissions from visitors to the site may be estimated and calculated as part of the Scope 1 emissions for HCMA, but they are often considered separately.
Current Conditions
HCMA currently operates almost 600 pieces of equipment, ranging from trucks to ATVs, as well as lawn and landscaping maintenance equipment. The vast majority of the equipment used by HCMA is operated by standard gasoline or diesel engines.
Baseline
HCMA consumed an estimated 174,047.4 gallons of gasoline and 69,584.9 of diesel fuel in 2024. This equates to 2,251.5 tCO2e of Scope 1 Mobile emissions, as well as 2.6 kg of PM2.5, $2,509 kg of carbon monoxide (CO), 163.6 kg of total hydrocarbons (THC). The emissions include $29.6 kg of nitrous oxide, which, in addition to its potency as a greenhouse gas, in the presence of hydrocarbons, can contribute to the creation of ground level ozone (O3), which is a criteria pollutant in unhealthy air quality.
Business As Usual Projection
The Scope 1 Mobile Emissions projection does not include any change operations for the next 10 years. As equipment is replaced, however, it may be replaced with battery-operated equipment, including hybrid vehicles, which reduces greenhouse gas emissions and eliminates criteria pollutant emissions. This presents opportunities for significant reduction in Scope 2 Mobile Emissions.
Opportunities
Mobile emission reduction primarily involves electrifying existing equipment, as most of the equipment used by HCMA has an electric or hybrid counterpart (e.g., electric and hybrid vehicles, battery-operated maintenance equipment). Many parks are already using electric golf carts with plans to continue to convert as older carts are retired. Where suitable equipment is not currently technologically mature (e.g., large electric lawnmowers), alternative fuels such as E85 (ethanol) and B20 (biodiesel) may reduce criteria pollutants until electric options are commercially available.
Actions include:
- Electrify small mowing equipment for greens and fairway maintenance.
- Reduce mowed areas to reduce equipment emissions from large mowing equipment.
- Develop battery charging infrastructure in maintenance barns and develop a brand and model standard to ensure battery compatibility for maintenance equipment such as blowers, push mowers, and other electric maintenance equipment.
- Explore biodiesel for large mowing and landscaping equipment.
- Explore electric and hybrid vehicles for light-duty trucks and passenger cars.
Transition to Electric Fleet
Current Conditions
Of the 600 pieces of equipment, approximately 200 are classified as Light or Medium-Duty Trucks or Passenger Cars.
Baseline
Vehicles range in age from 15 years old to brand new. 22 of the vehicles are passenger cars. The remainder would be classified as Light Duty Trucks (e.g., F-150, F-250) or SUVs (e.g., Ford Escape). Currently there are two Ford Mustang Mach-E electric sedans in use, and there is a two-plug Level II charging station at the Willow Park administrative office.
Opportunities
Light Duty Trucks/SUVs and passenger cars have currently commercially available electric and hybrid vehicle (EV/EHV) alternatives that have been in the market for approximately four years. For medium and heavy duty vehicles, HCMA may look into Biodiesel as an alternative fuel. Biodiesel reduces greenhouse gas emissions through its lifecycle, reducing emissions versus petroleum based diesel by approximately 15% for B20 (the most common mix that does not require new equipment). Biodiesel is also sulfur free and reduces particulate matter emissions. Nitrogen oxide emissions may require additional catalytic converter technology to provide significant reductions versus fossil fuel-based diesel.
Savings from transition to electric vehicles are significant. If the 150 light duty trucks transitioned to all electric vehicles, would eliminate 569.5 tCO2e emissions annually from Scope 1 Mobile emissions. Converting them to hybrid vehicles would eliminate 141.5 tCO2e (plug-in hybrid vehicles are approximately 4 times more efficient than conventional vehicles when operating with electric charging, as most trips are less than 37 miles and do not require gasoline).
Actions include:
- Conducting an electric vehicle charging infrastructure feasibility study to determine the locations that can support Level II (240V and Level III (DC Fast Charging) infrastructure for staff, visitor and fleet vehicles for each Park.
- Electrify the remainder of golf carts by 2030.
- Provide Level II electric vehicle charging for Park visitors.
- Develop a feasibility study for electric transit to serve among Parks and between Parks and transit nodes in the Metropolitan Area.
- Explore manual/electric bicycle and scooter bicycle sharing options to encourage non-vehicle transportation to Parks.
- Encourage EV transportation through discounts and perks.
Facility Emissions Baseline
Current Conditions
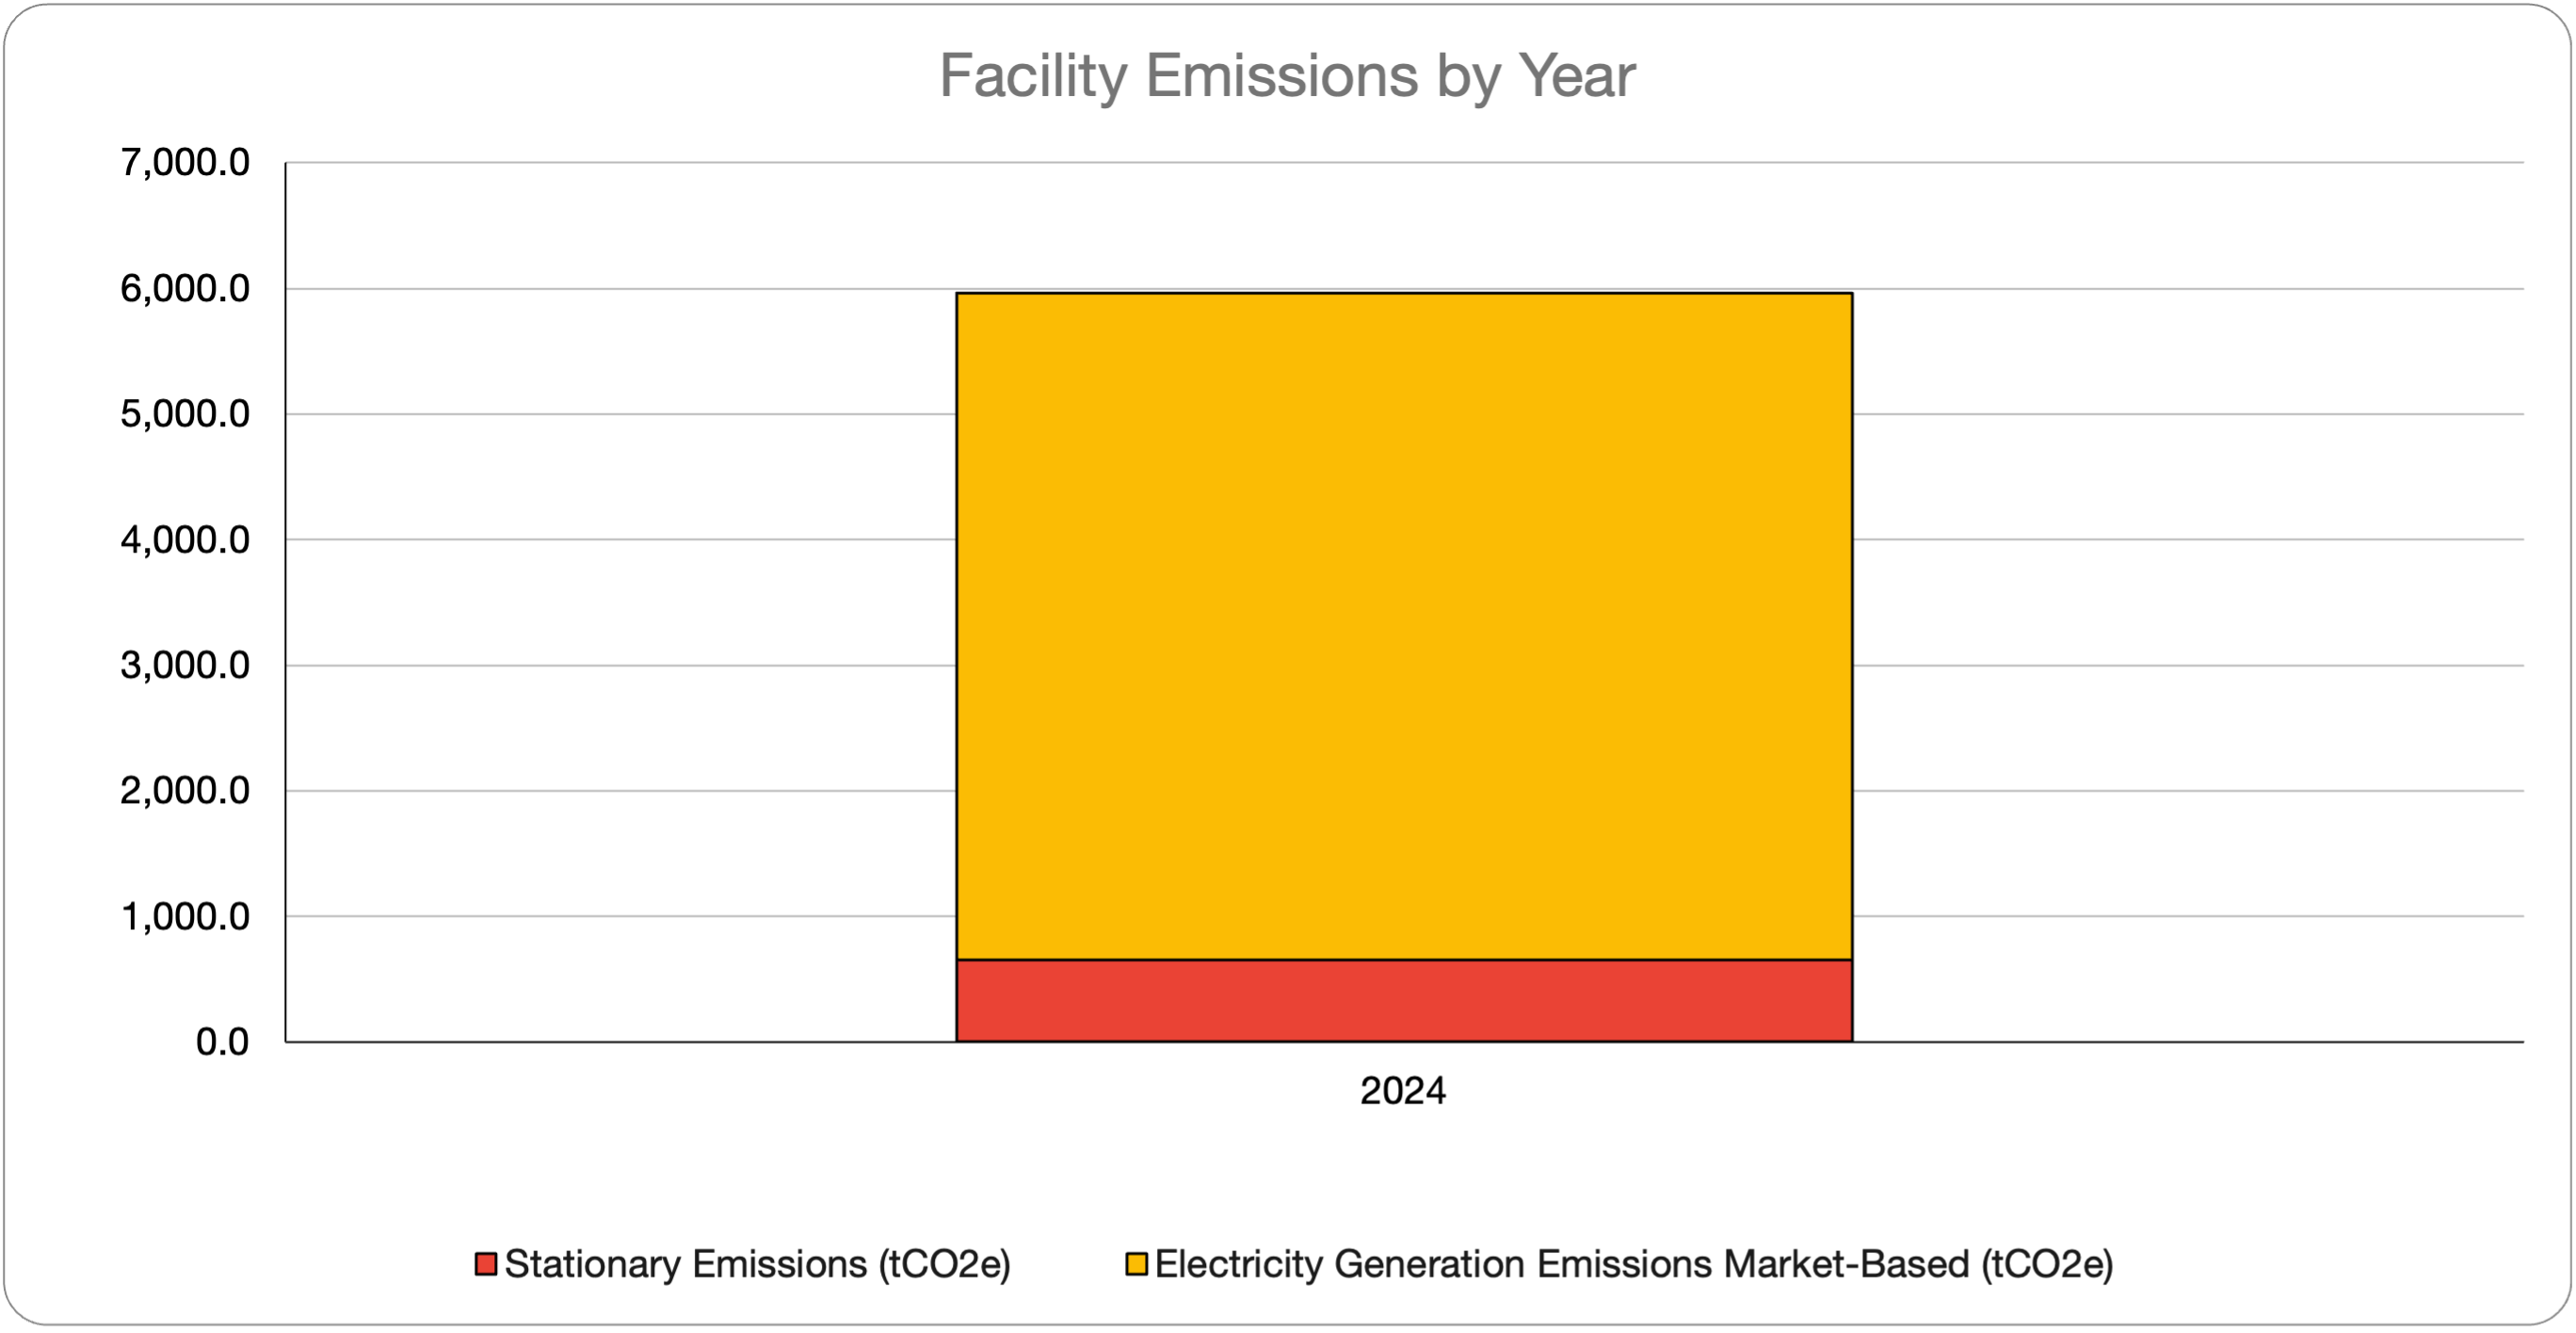
Facility emissions include Scope 1 Stationary emissions from using natural gas for heating and hot water, and Scope 2 Electricity Generation emissions from purchased electricity used in facilities for space and air conditioning and plug load. Taken together these are a significant source of emissions for HCMA.
There are 183 locations that have structures in the inventory of facilities managed by the HCMA. These include buildings such as office and administrative buildings, warehouse and maintenance buildings, comfort stations, pump houses, and recreational facilities. 152 of the locations have electricity accounts with at least one meter, and may serve several buildings. Together these locations used 5,048 MWh of electricity contributing 5,305 tCO2e of market-based electricity generation Scope 2 emissions and 118,588 therms of natural gas and propane in 2024 emitting 655 tCO2e of Scope 1 stationary emissions. Figure 4 shows that the majority of facility emissions are from electricity generation.
Emissions were modeled based on the 2024 environmental disclosure reporting of DTE for electricity consumption. This provides a more accurate representation of emissions from electricity consumption, as the generation mix reported by DTE is more likely to be the source of electricity than the generation mix of the regional independent system operator as a whole (known as location-based emissions). This figure should be updated annually to reflect changes in the fuel mix used by DTE, or to reflect a different fuel mix from an alternative retail electricity supplier that may be contracted with by the HCMA for cleaner electricity supply.
Baseline
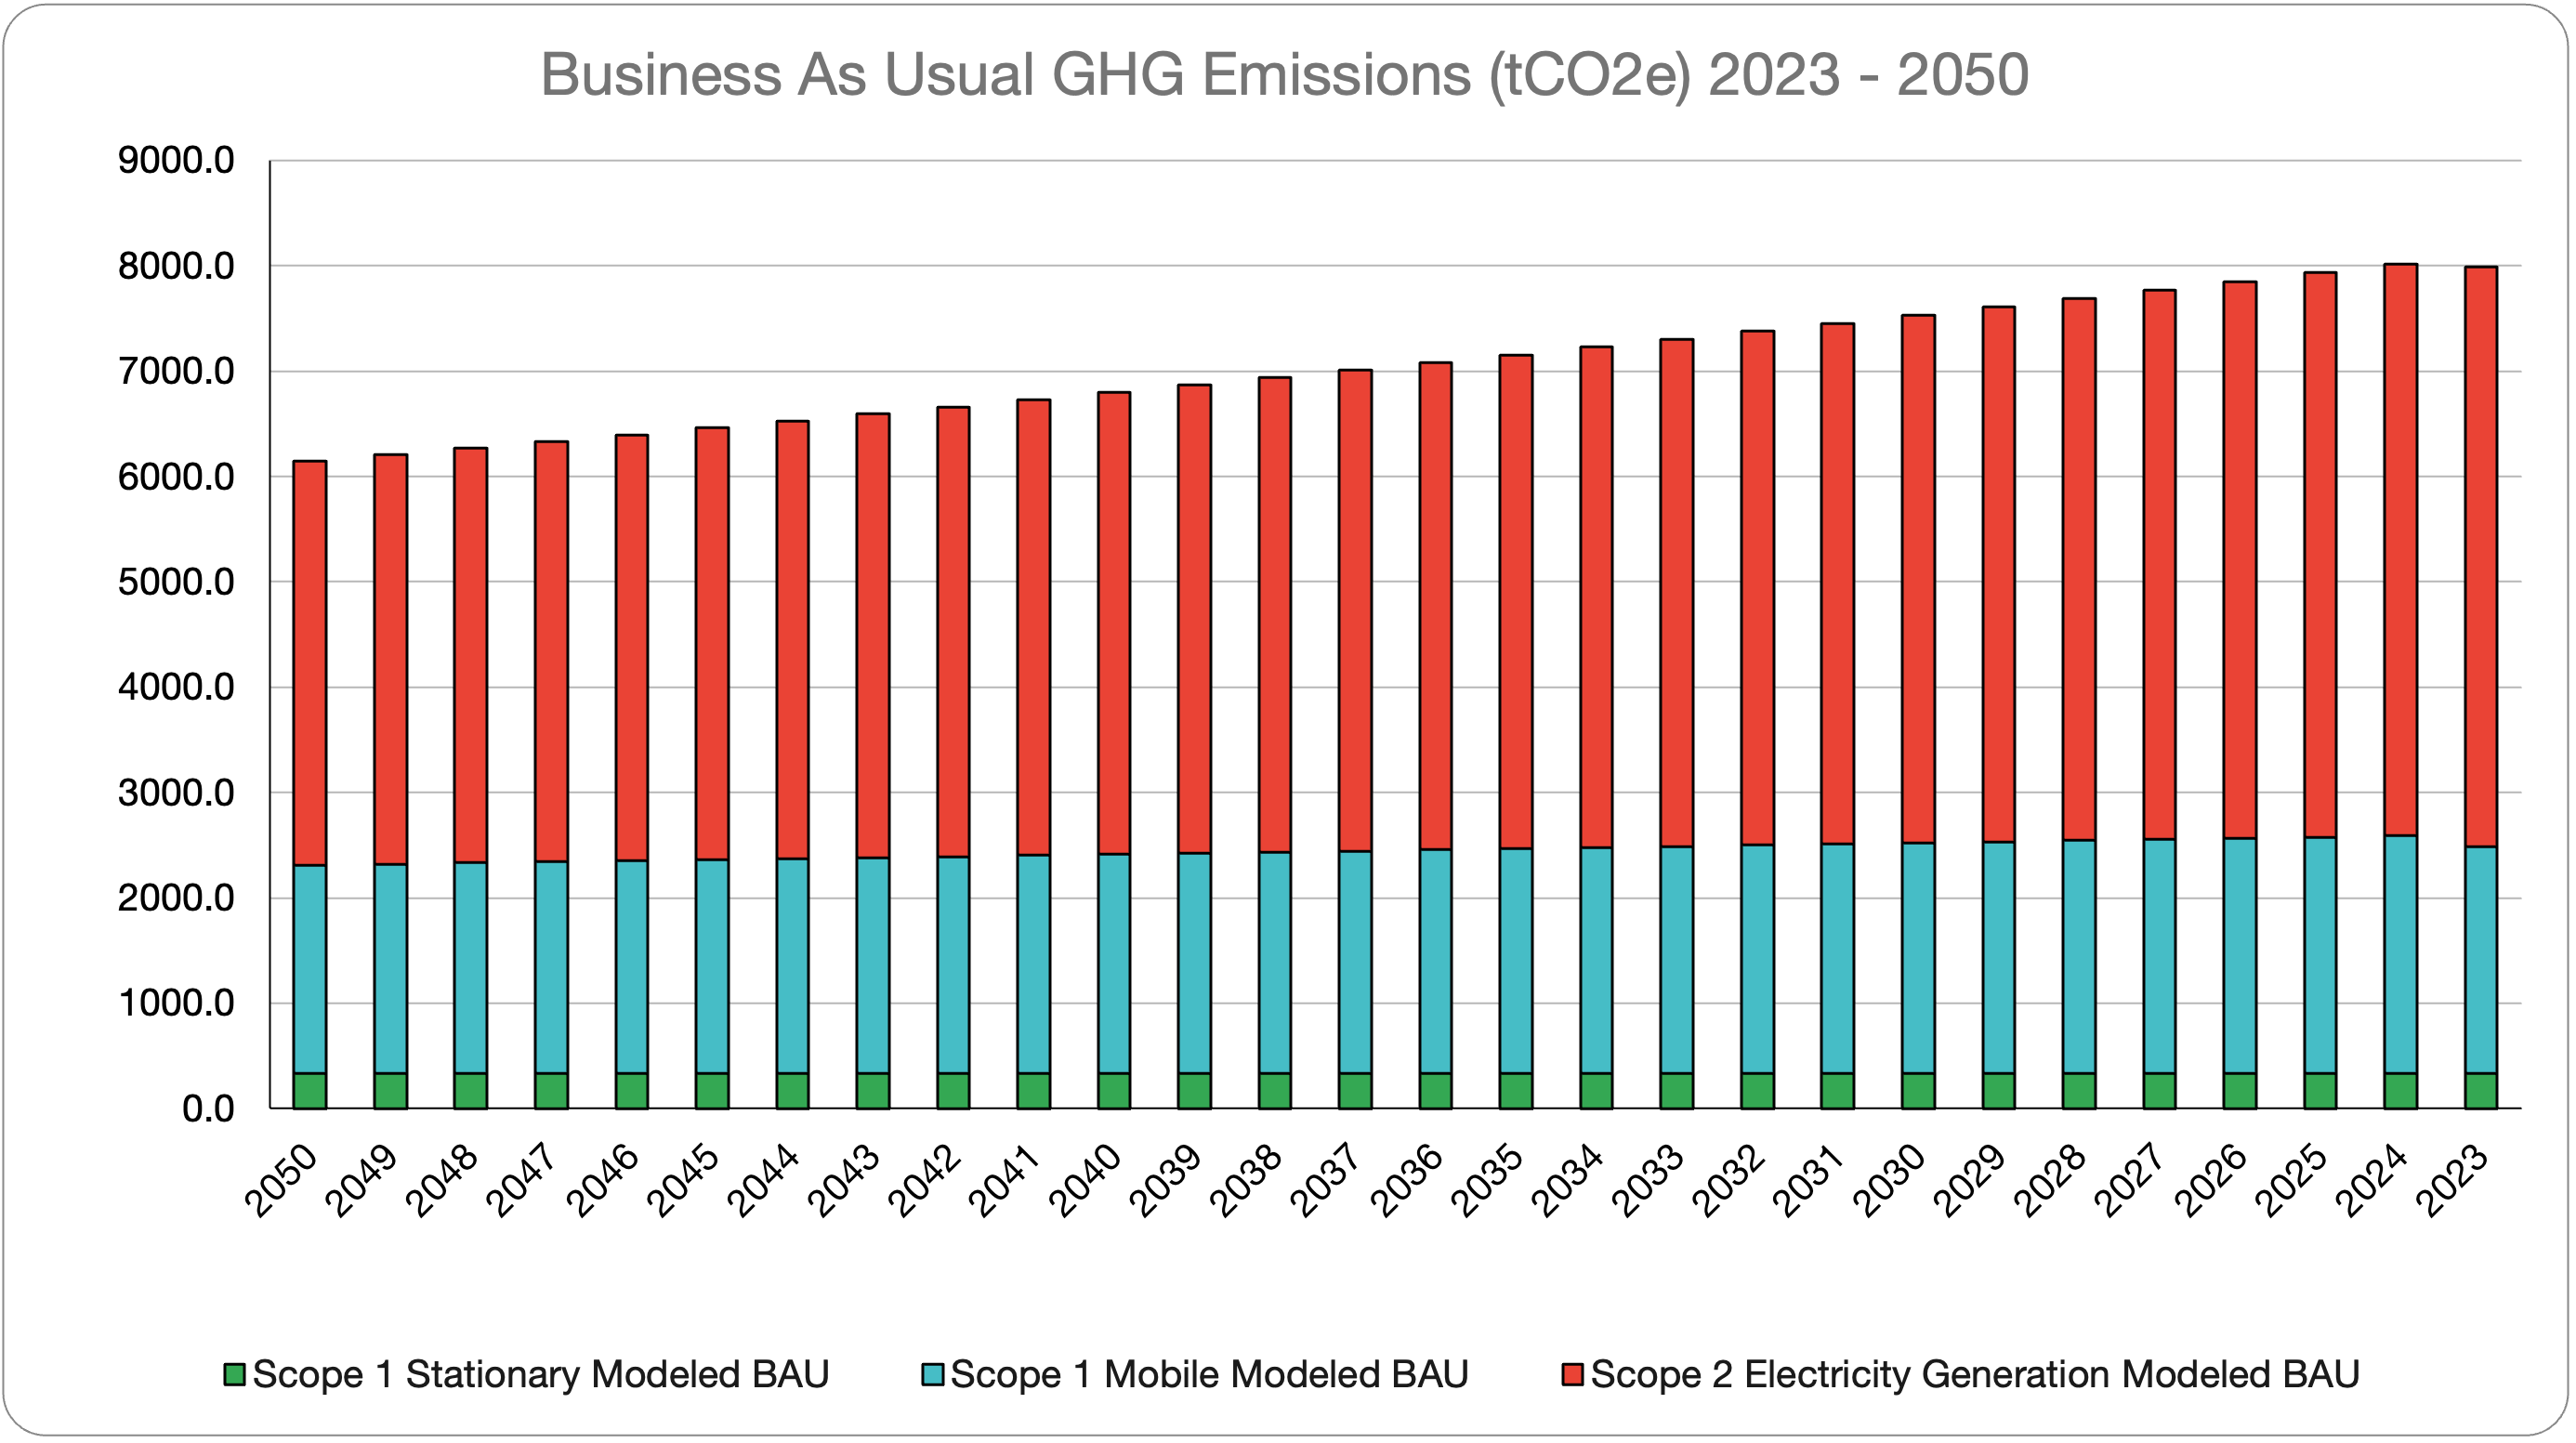
The baseline and business-as-usual assumptions for buildings assume nothing will change in operations while the grid continues to reduce its use of fossil fuels for generation at approximately 2% per year. This will reduce the HCMA’s Scope 2 generation emissions through approximately 2035 as the last of the coal plants in operation are retired and renewable energy hits a peak of 30% to 40% in generation mix before leveling off. All other emissions reductions will be from two major activities: energy efficiency retrofits and distributed renewable generation installations (onsite renewable energy such as small scale wind and solar photovoltaic systems). Figure 5 shows how facility emissions will reduce through 2050 with no change in operations.
Energy efficiency, which is replacing energy using equipment with more efficient technology, is a preferable “eat your veggies first” approach to reducing building emissions. Distributed generation is often considered at the same time, as the size of building-integrated renewable energy systems can be reduced if the demand for electricity is lower. An additional benefit of building-integrated electricity generation is that it eliminates emissions beyond consumption, as the energy consumption report at the meter is after a loss of 50% of the energy generated at the generation facility through heat loss and 5% of the energy generated through resistance in transmission lines. Distributed generation is sized to potentially deliver up to 110% of total consumption of a building, with excess being sold back to the grid at retail rates.
Taken further, buildings that have natural gas or propane heating can convert to all electric, eliminating Scope 1 emissions. This is known as beneficial electrification and is possible with heat pump technology providing heating and cooling, with electric resistance backup. Though this is more expensive to operate than natural gas, if fixed customer costs are taken into account and renewable energy is factored in, operating an all electric building will pay for the conversion within the life of the new equipment. This needs to be addressed on a case by case basis. The net effect of beneficial electrification would be to eliminate Scope 1 Stationary emissions with a corresponding but lower increase in Scope 2 Electricity Generation emissions. These can then be mitigated with distributed generation and the “greening” of the grid.
Another option, for consideration, is the purchase of renewable energy credits (RECs) to offset emissions, as well as carbon credits, and retiring them. Though this option does indirectly lower the HCMA’s carbon footprint, it is an option that should be considered alongside energy efficiency and onsite renewable energy. Taken over several years, the budget spent on RECs and offsets could be spent on permanent reductions at the source.
Finally, electronics recycling was reviewed for the HCMA. This effort, which reduces the lifecycle emissions of electronics including batteries and lightbulbs, reduced emissions by 4.4 tCO2e in 2024.
Opportunities
Actions include:
- Develop an Energy Use Intensity (EUI) map for select buildings to identify high energy users and conduct targeted energy audits.
- Develop a standard of prescriptive efficiency requirements for buildings that follows the latest International Energy Conservation Code standard (e.g., all lighting must be LED for replacements and shall be 100% LED by 2028).
- Explore beneficial electrification and heat pump technology for buildings that have major HVAC improvements.
- Explore building-integrated or ground-mounted renewable energy such as solar photovoltaic or small-scale wind. Develop a plan to meet a percentage of consumption within 10 years.
- Develop 5-year retrocommissioning and maintenance plans for all energy using equipment. Retrocommissioning involves reviewing design intent of equipment operations and identifying and fixing out of specification operations.
- Choose low-Global Warming Potential refrigerants in new equipment.
- Convert to all electric appliances.
- Review electrical service upgrades with an eye toward providing electrification potential including EV charging infrastructure.
- Conduct a refrigerant inventory by cataloging all refrigerant containing equipment (type, brand, model, year of installation, refrigerant type, lbs of refrigerant at full charge, annual maintenance documentation including recharged refrigerant).
- Document waste reduction efforts by tracking weight (or volume if weight is not available) of landfill, consumable recycling, and organics composting efforts.
Targets
The results of this inventory should be used to identify and consider short (1 - 3 year), medium (4 - 10 year) and long (11+ year) term targets. Setting absolute reduction targets for Scope 1 and Scope 2 emissions by further researching the feasibility of alternatives will lead to the development of a low-carbon transition plan. Targets should be S.M.A.R.T. (SBTi) - specific, measurable, achievable, relevant and time-bound. The results of the inventory provide the scope and measurements for reductions.
Targets do not need to be aggressive to be effective. One such target framework, the Science-Based Targets Initiative (SBTi), identifies potential targets that would allow the HCMA to contribute to maintaining the total climate change effect to less than 1.5°C over a 30 year average. Doing so would likely require an approximately 60% reduction in emissions over 10 years, which may not be in line with the goals of the HCMA. However, targets can lead to focus, which provide the foundation of a low-carbon transition plan that will work for the HCMA.
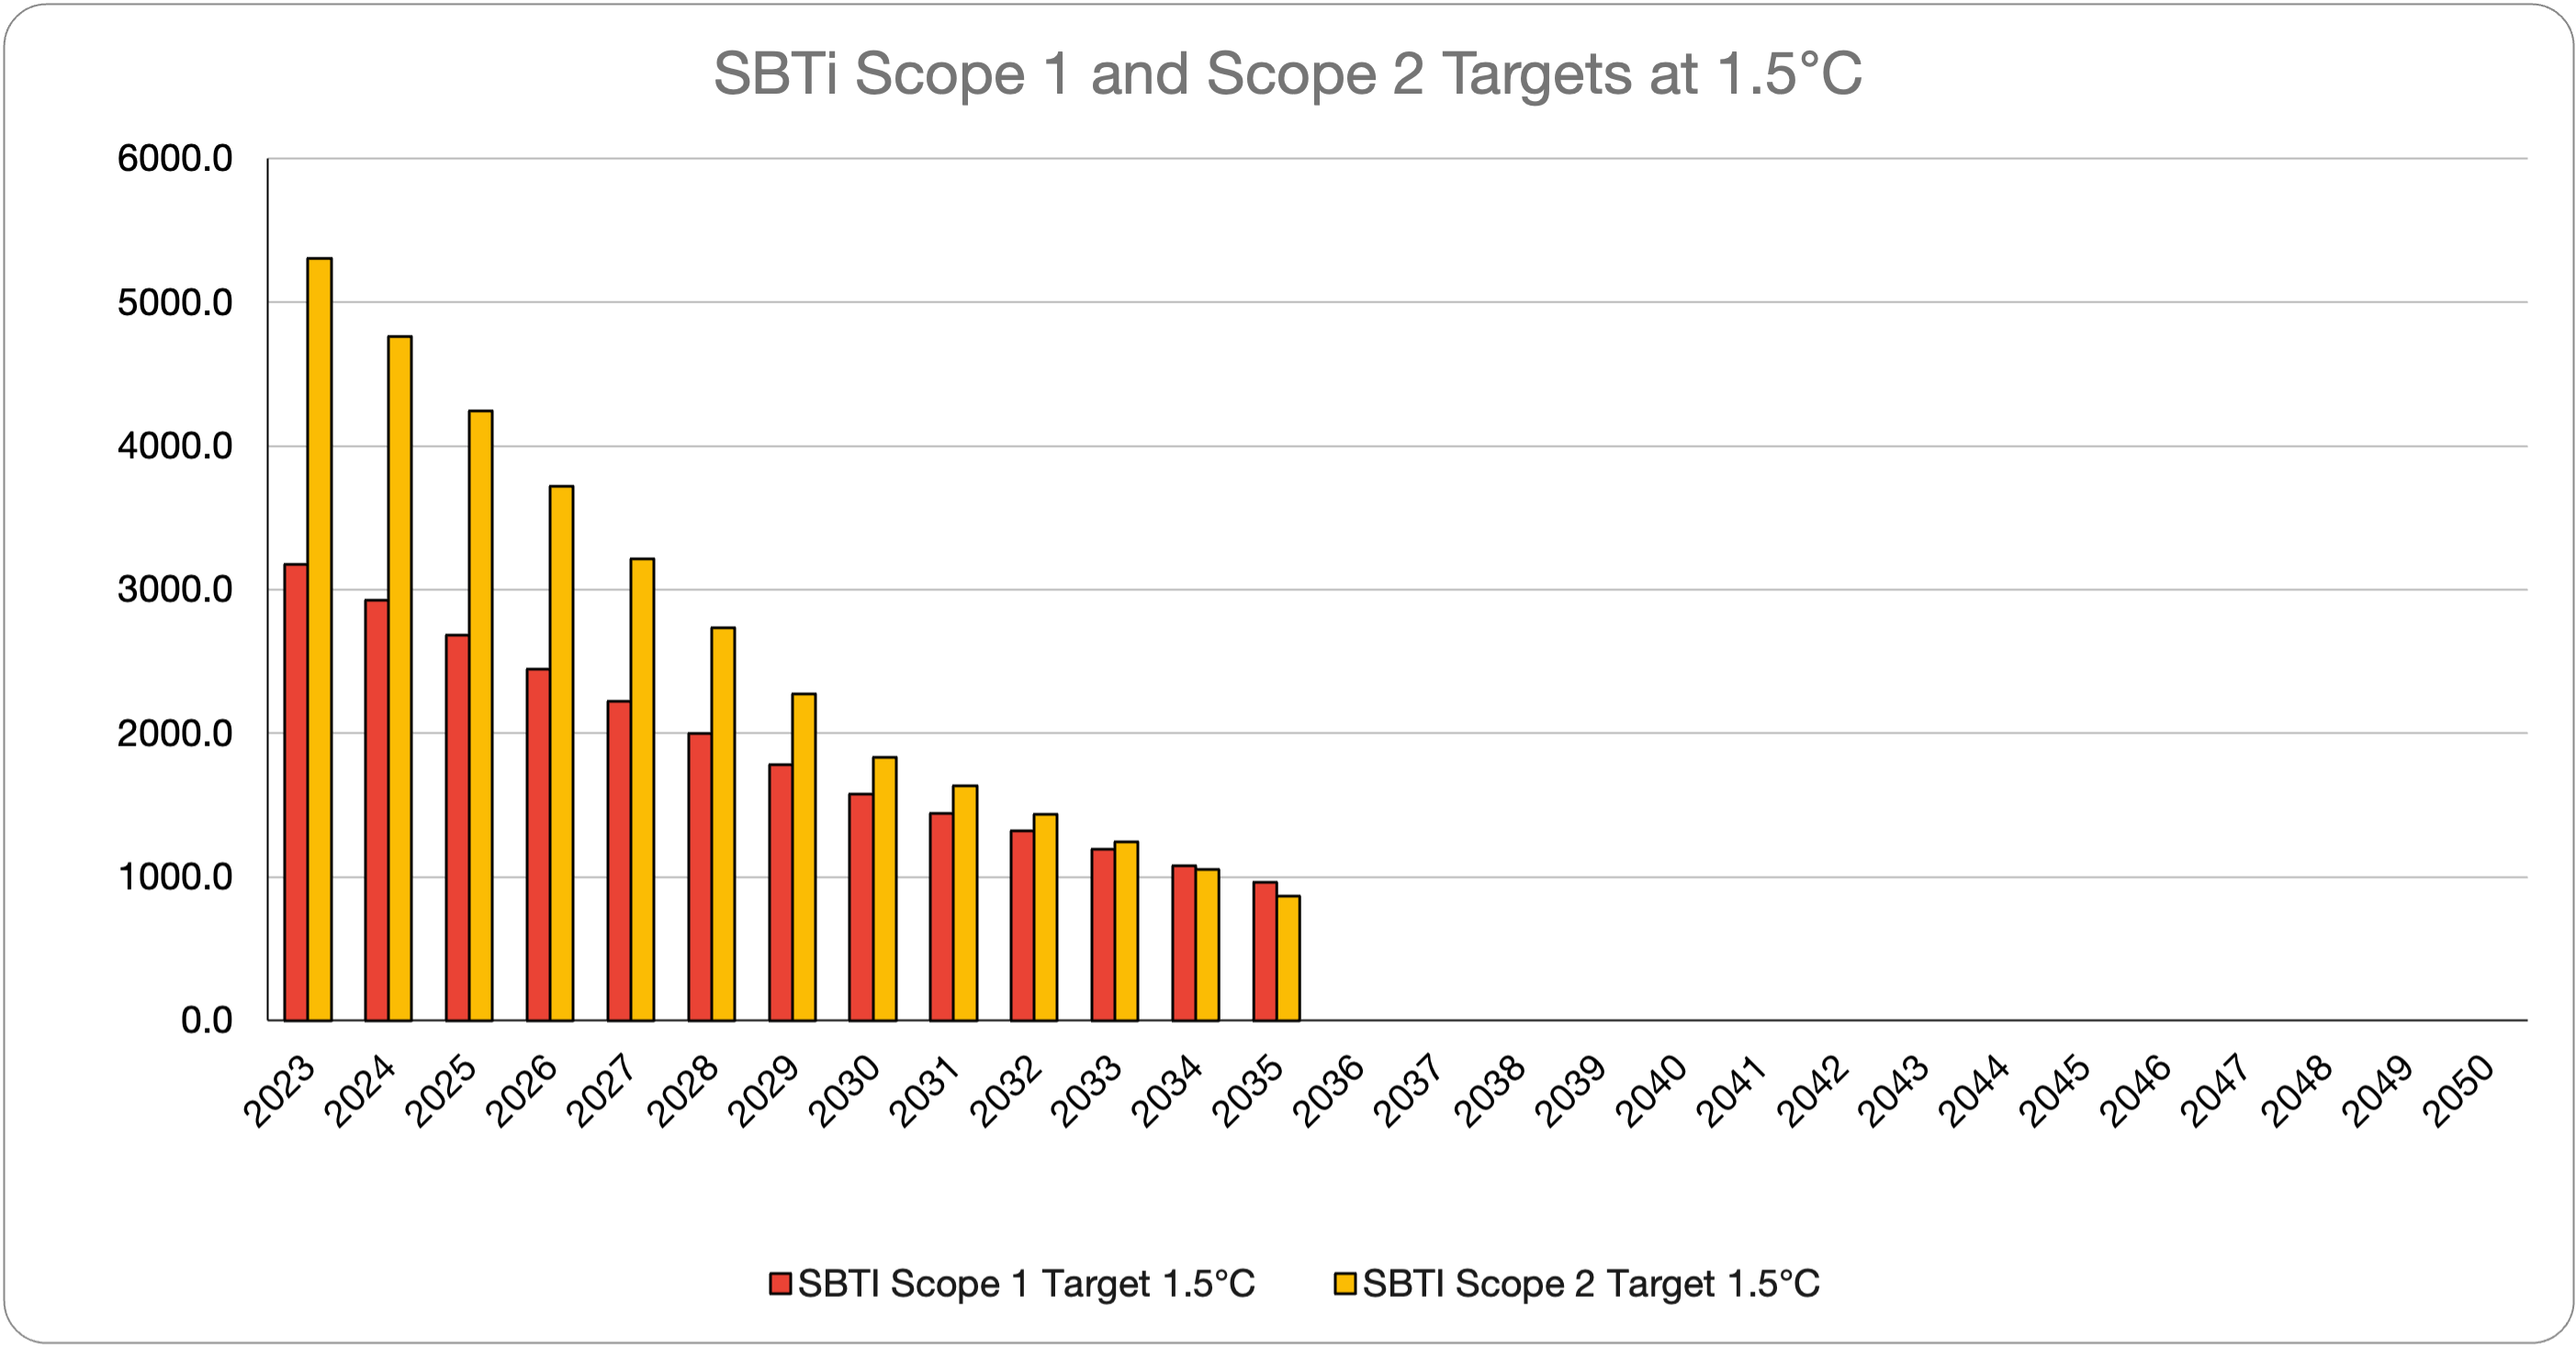
An example of Science-Based Targets is included below in Figure 6. They represent a deep cut of almost 70% of Scope 1 emissions and 84% Scope 2 emissions within the next decade, with an assumed trend to net-zero by 2050 (SBTi targets do not compute beyond 2035). Though technically achievable through massive investment in beneficial electrification, vehicle electrification and distributed generation, this is likely to be beyond the capability and budget of the HCMA to achieve, but serves as a benchmark for a best-case scenario that may guide the HCMA in future target setting.
Comparison to Similar Parks
Scope 1 and Scope 2 emissions of the HCMA were compared with two other similarly sized park systems that publicly report their emissions. HCMA emissions are in line with expectations based on a cursory review. Most park districts reviewed were not broken out separately, but included in municipal emissions. We found some in the last decade that provided Scoped emissions broken out as well as peak visitor counts. These are included below:
Table 6. Comparison Emissions by Park
| Park | Peak Annual Visitors | Scope 1 Emissions (tCO2e) | Scope 2 Emissions (tCO2e) | Total Emissions Per Visitor (tCO2e) |
|---|---|---|---|---|
| HCMA | 10M | 2,906.0 | 5,305.0 | 0.0008 |
| Three Rivers Park District, MN | 12.6M | 5,500.0 | 4,500.0 | 0.0007 |
| Forest Preserve District of DuPage County, IL | 6M | 2,400.0 | 1,804.0 | 0.0007 |
Emissions Breakdown by Scope (Visuals)
Figure 1. Total Facility and Mobile Sourced Emissions for 2024
GHG Emissions by Scope (Figure 2)
Figure 2. Greenhouse Gas Emissions by Scope
Facility Emissions by Year (Figure 4)
Figure 4. Facility Emissions by Year
Business As Usual Emissions Projection (Figure 5)
Figure 5. Business As Usual Emissions Through 2050
Example Science-Based Targets (Figure 6)
Figure 6. Example Science-Based Targets by 2035
Full Annual Data Table (Raw Data)
Glossary
ACRONYMS
- 389nm
- 389nm LLC
- CAP
- Criteria Air Pollutants
- CFR
- Code of Federal Regulations
- CIS
- Corvias Infrastructure Solutions
- ECM
- Energy Conservation Measures
- EGLE
- Michigan Environment, Great Lakes, and Energy
- EPA
- U.S. Environmental Protection Agency
- GHG
- Greenhouse Gas
- HAP
- Hazardous Air Pollutants
- HCMA
- Huron-Clinton Metroparks Authority
- SOV
- Single Occupancy Vehicle
DEFINITIONS
- Business-as-Usual (BAU)
- A projected scenario of greenhouse gas (GHG) emissions that assumes the continuation of current patterns of activity without the implementation of additional interventions or policies. This baseline is used for comparison against alternative climate action strategies.
- Carbon Dioxide Equivalent ($CO_2e$)
- The GWP of a specific greenhouse gas expressed as a ratio of equivalent warming potential to CO2 over a period of time. E.g., methane has a GWP of 28 - 36 over 100 years (U.S. Environmental Protection Agency, 2021).
- Carbon Sequestration
- Carbon capture and sequestration (CCS) refers to a suite of technologies designed to significantly reduce carbon dioxide CO2 emissions from stationary sources such as coal- and gas-fired power plants and industrial facilities. In addition to technological methods, natural carbon sequestration as forests, soils, and wetlands can absorb and store atmospheric CO2, serving as critical carbon sinks that help lower greenhouse gas concentrations in the atmosphere.
- Clean / Renewable Energy
- Energy that can be produced from renewable sources without emitting greenhouse gases. Transitioning to clean energy can help advance many of the Pokagon Band’s environmental and economic goals by increasing further investment in alternative fuel vehicles and equipment, improving energy efficiency of their buildings, and reducing the orgaization’s carbon footprint.
- Decarbonization
- The process of systematically reducing or eliminating carbon dioxide emissions associated with energy production, industrial activities, and other sectors. Decarbonization is a key strategy for mitigating climate change and transitioning to a low-carbon economy.
- Fossil Fuels
- Carbon-based energy sources formed from the decomposition of ancient organic matter over millions of years. Common types include coal, crude oil, and natural gas. Fossil fuels are a major contributor to greenhouse gas emissions and environmental degradation when combusted for energy.
- Fugitive Emissions
- Emissions which are released into the atmosphere accidentally.
- Global Warming Potential (GWP)
- The potential of different greenhouse gases to produce the greenhouse effect as compared to carbon dioxide, which has a GWP of 1 (U.S. Environmental Protection Agency, 2021).
- Greenhouse gas (GHG) Inventory
- A list of emission sources and sinks and the associated emissions quantified using standard methods.
- tCO2e
- Also MtCO2e, or metric tonnes of carbon dioxide equivalent. The Standard International System of Units (SI) unit of measurement of GHG. 1 tCO2e is equal to 1 metric tonne of CO2, or 1,000 kilograms (kg) using the base SI unit of measurement.
- Mitigation
- Prevention or intervention of climate harming activities. This includes reducing emissions and stabilizing levels of GHGs in the atmosphere.
- Mobile Emissions
- These emissions are air pollutants released from moving sources, primarily vehicles, transportation equipment, and farm equipment.
- Examples of sources: cars, trucks, buses, motorcycles, airplanes, ships, tractors, and trains.
- Common pollutants: carbon monoxide (CO), nitrogen oxides ($NO_x$), particulate matter (PM), volatile organic compounds (VOCs), and greenhouse gases like carbon dioxide (CO2).
- Natural gas
- Fuel source categorized as a fossil fuel. Natural gas can create harmful environmental impacts, such as pollution.
- Organizational Boundaries
- These are set by an organization choosing an approach for consolidating GHG emissions and then consistently applies that approach to define the entities and assets included in Scope 1 and Scope 2.
- Particulate matter (PM)
- Also called particle pollution, the term for a mixture of solid particles and liquid droplets found in the air. Some particles, such as dust, dirt, soot, or smoke, are large or dark enough to be seen with the naked eye. Others are so small they can only be detected using an electron microscope. PM causes severe health issues as well as contributes to environmental degradation.
- Resilience
- Ability to adapt to changing conditions and withstand and rapidly recover from disruption due to emergencies.
- Scope 1 Emissions
- Direct greenhouse (GHG) emissions that occur from sources that are controlled or owned by an organization (e.g., emissions associated with fuel combustion in boilers, furnaces, vehicles).
- Scope 2 Emissions
- Indirect GHG emissions associated with the purchase of electricity, steam, heat, or cooling. Although scope 2 emissions physically occur at the facility where they are generated, they are accounted for in an organization’s GHG inventory because they are a result of the organization’s energy use.
- Scope 3 Emissions
- These are other indirect emissions from supply chain activities, such as waste management and electronics recycling. This inventory provides a limited assessment. With more detailed tracking in the future, Scope 3 emissions may be estimated. They are typically over half of the emissions related to an organization’s operations.
- Stationary Emissions
- Stationary emissions are pollutants released into the air from fixed sources that do not move. These sources typically include factories, power plants, boilers, furnaces, and other industrial or commercial/office facilities.
- Examples of pollutants: carbon monoxide (CO), sulfur dioxide (SO2), nitrogen oxides (NOx), particulate matter (PM), and volatile organic compounds (VOCs).
- Therms
- A unit of heat energy used primarily to measure natural gas consumption. It represents the amount of heat required to raise the temperature of about 2,621 pounds (1,189 kilograms) of water by 1°F. 1 therm = 100,000 British Thermal Units (BTUs) = approximately 29.3 kilowatt-hours (kWh) of energy.
- Vehicle Miles Traveled (VMT)
- Vehicle Miles Traveled, a unit of measurement helpful for calculating transportation-related emissions.